Skip to Content

Business Intelligence & Revenue Operations

Turn messy business data into clear decisions

Strevie helps growing SMEs connect disconnected systems, reduce manual reporting and build trusted visibility across revenue, margin, sales, operations and performance.

Clear dashboards Predictable revenue Better decisions
Practical BI capability without the cost or complexity of building a full internal data team.
Clear business visibility
Management Reporting

Business Overview

Reporting connected
Revenue visibility Connected Finance + CRM
Margin reporting Defined Trusted logic
Pipeline outlook Visible Clear stages

Performance visibility

Reporting health

KPI definitions Agreed
Data sources Connected
Leadership view Clear
CRM Finance Operations Service Spreadsheets

Illustrative reporting view

Visibility See what is happening

Bring important commercial, financial and operational information into a clearer view.

Confidence Trust what the numbers mean

Improve KPI definitions, reporting consistency and confidence across teams.

Action Make better decisions

Turn reporting into practical information that helps the business prioritise and act.

When reporting becomes difficult

Growing businesses often have the data—but not the visibility

Information becomes spread across CRM, finance, ERP, service, operational platforms and spreadsheets. Preparing reports takes longer, numbers stop matching and leadership struggles to get one reliable view.

Reporting takes too long

Teams repeatedly export, copy, reconcile and rebuild the same information.

Numbers do not match

Different departments use different logic, definitions and versions of the truth.

Decisions become reactive

Issues and opportunities are identified after they have already affected the business.

From disconnected systems to one clear view

CRM & sales
Finance & ERP
Operations & service
Strevie reporting layer
Clear dashboards
Trusted metrics
Better decisions

The goal is not more reporting. It is clearer, repeatable information that supports how the business is managed.

Practical BI support

Start where your business needs the most help

Begin with a focused review, move into dashboard delivery when the requirement is clear, or establish ongoing support to keep reporting improving over time.

02
Scoped delivery

Dashboard Builds

Practical dashboards designed around the questions, metrics and decisions that matter to your business.

  • Requirements and KPI definition
  • Data preparation and modelling
  • Dashboard build, validation and handover
03
Ongoing partnership

Fractional BI Partner

Flexible ongoing BI and Revenue Operations support without immediately building a full internal team.

  • Dashboard maintenance and improvement
  • New reporting, KPIs and analysis
  • Prioritised monthly BI and RevOps backlog

A practical path forward

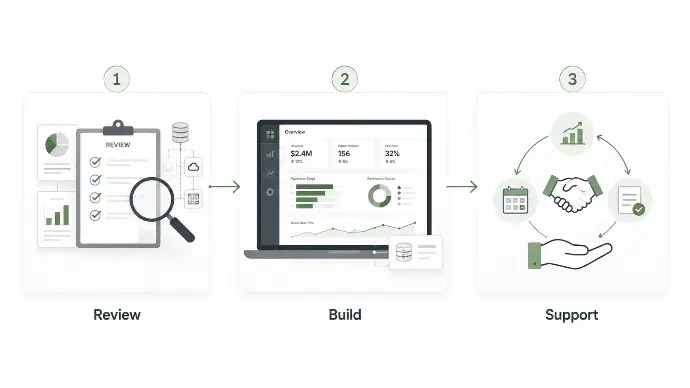
Review, build and improve

You do not need to solve every reporting problem at once. Start with clarity, deliver the highest-value improvements and build capability over time.

1

Review

Understand the current reporting, systems, gaps and highest-priority opportunities.

2

Build

Create practical dashboards and reporting around agreed questions and KPIs.

3

Support

Keep the reporting relevant, reliable and aligned as the business changes.

Strevie business intelligence process showing Review, Build and Support

Business outcomes

Improve more than the appearance of your reports

Good BI should improve visibility, reduce reporting effort and help leaders understand performance early enough to take action.

Clearer visibility

See revenue, margin, pipeline, operations and performance more clearly.

Trusted information

Establish clearer definitions and reduce disputes over what the numbers mean.

Less manual reporting

Reduce repeated exports, spreadsheet consolidation and time-consuming preparation.

Stronger control

Identify issues, trends and opportunities before they become larger problems.

Why Strevie

Business reporting—not technology for its own sake

Strevie connects technical BI delivery with the commercial, financial and operational questions that leadership teams need reporting to answer.

Business-first

Start with decisions, users and outcomes before choosing charts or technology.

Practical scope

Work through visible priorities and agreed deliverables rather than open-ended complexity.

Trusted definitions

Clarify the logic behind important KPIs so users understand and trust the reporting.

Built to evolve

Improve reporting as your systems, priorities and business questions change.

Work with your existing systems

Make better use of the information you already have

Better visibility does not always require replacing your technology. Often, the greatest value comes from connecting existing information and improving how it is defined, prepared and used.

Power BI Business Central HubSpot Salesforce Autotask Odoo Excel SQL Finance & ERP systems Operational platforms

Your exact systems do not need to appear here. The starting point is understanding where the information sits, how it is currently used and what the business needs to see.

Not sure where to begin?

Start with a clearer view of your reporting

The BI Health Check identifies the most important reporting gaps, quick wins and next steps—without committing your business to a larger dashboard or technology project.